Popis
– all projects can be created only in Visualis
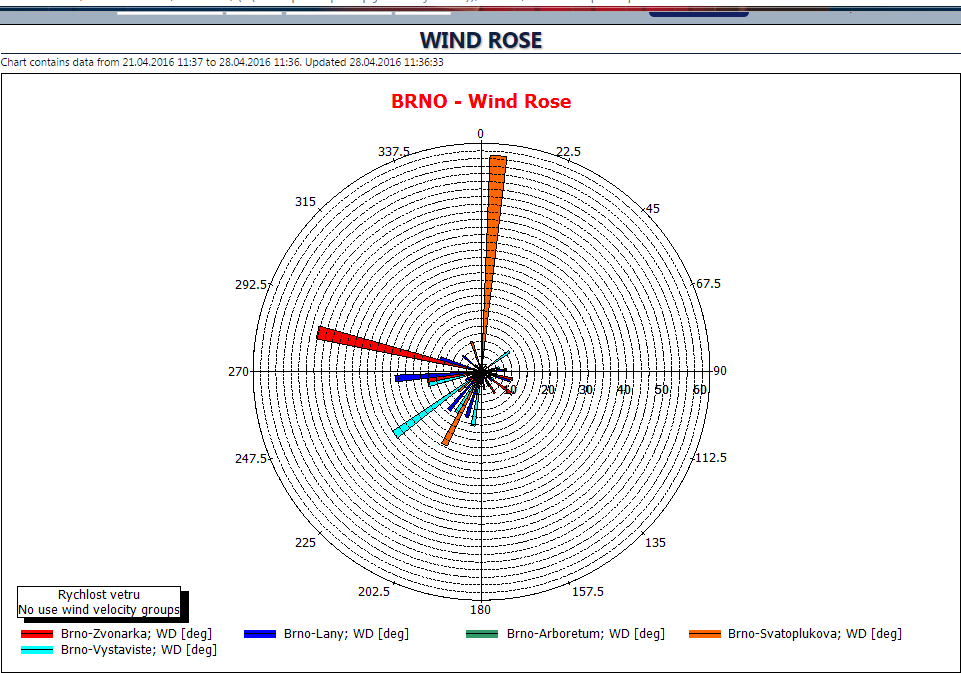
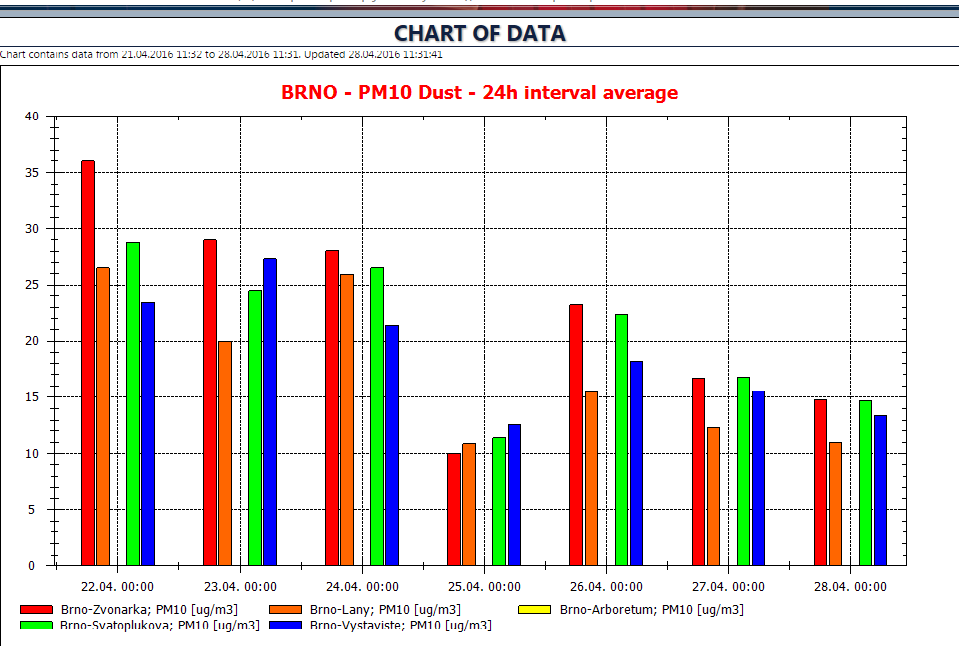
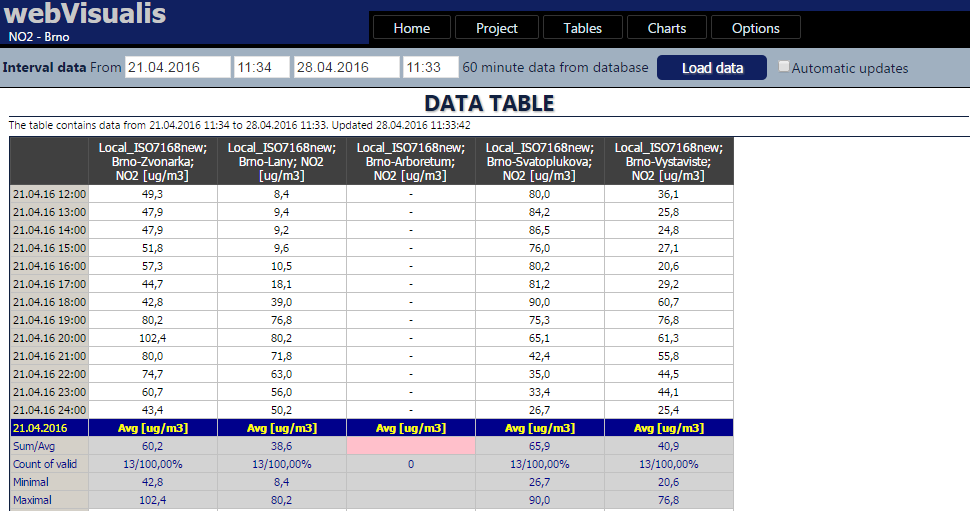
– displaying data in graph, table and wind rose (mathematical graph, which calculates with Wind direction, speed and pollutant concentration) view.
– displaying of all statistical tools, which can be displayed in Visualis and could be also independently displayed in month and year tables
– displaying of calibration results in a summary graphs and tables
– Marking data different attributes from both types of monitoring (air quality and emission)
– Exporting all tables into text or MS Excel formats
– Exporting all graphs into pictures formats
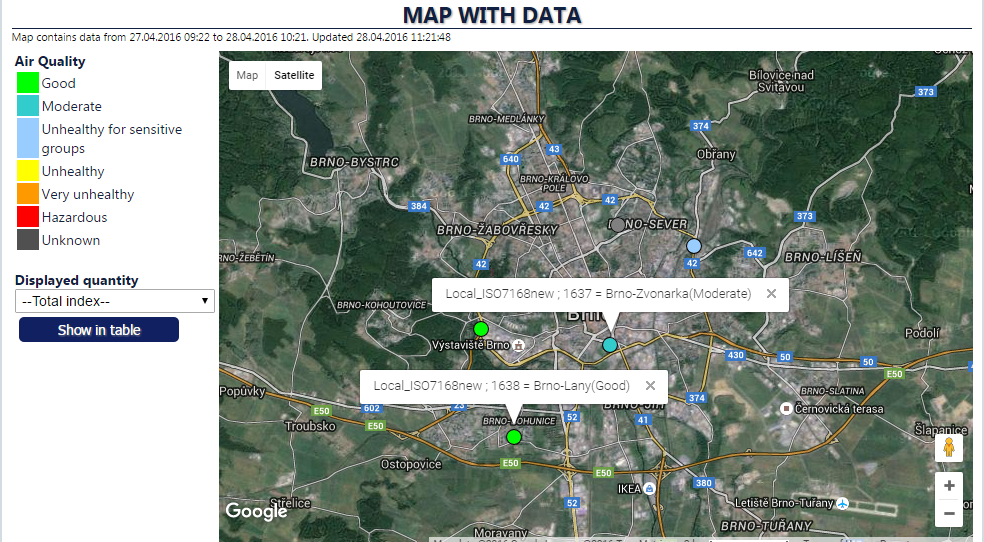
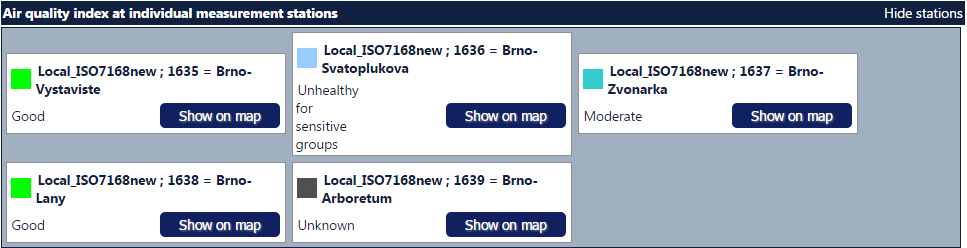
– Displaying of Air Quality Index projects, also with possibility to show them on a geographical background or maps with several points with different color (according to specific Air Quality Index at the locality).
– Automatic updates for all projects
– Visualis is needed only for creating projects for WebVisualis, it is not necessary to install Visualis at the computer, where is WebVisualis installed.